• This web contains the official documentation of the TWiki-5.0 Release, code named HelsinkiRelease. It is a read-only web for reference.
• This is an older release, see TWiki-6.1 for the latest release documentation.
• This is an older release, see TWiki-6.1 for the latest release documentation.
Chart Plugin
Introduction
Six types of charts, line, area, bar, scatter, combo, and spark are currently available:| Type of Chart | Name | What it Does | Example |
|---|---|---|---|
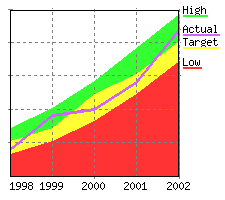
| Area | area |
Shows a chart using areas under a line to represent the data | 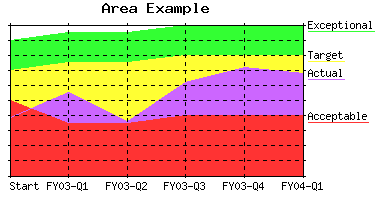 |
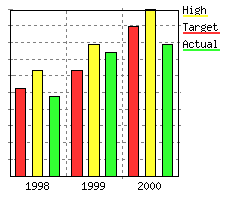
| Bar | bar |
Shows a chart using bars to represent the data |  |
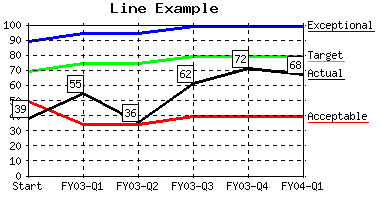
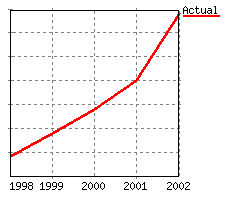
| Line | line |
Shows a chart using simple lines, points only, or lines with points to represent the data. Note: Any areas that fall behind already drawn areas are drawn as lines to make them visible |
 |
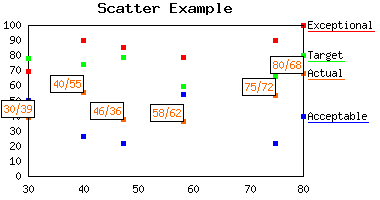
| Scatter | scatter |
Shows a scatter chart (XY data points) and allows mixing area or bar with line, point, and pline |
 |
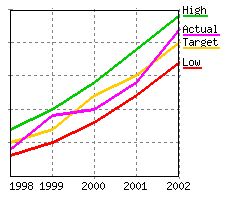
| Combo | combo |
Shows a chart combining the features from area or bar with line, point, and pline Note: Formally known as arealine which is still supported |
 |
| Sparkline | sparkline |
Shows a sparkline that are part of the flow of a sentence or paragraph. that are part of the flow of a sentence or paragraph. |
|
| Sparkbar | sparkbar |
Shows a  sparkline in the shape of small bars. sparkline in the shape of small bars. |
|
| Sparkarea | sparkarea |
Shows a  sparkline in the shape of an area. sparkline in the shape of an area. |
|
%CHART{...}% variable gets expanded to an image representing the chart. Parameters and global settings determine the type of chart, dimensions, and values.
ChartPlugin Global Settings
Plugin settings are stored as preferences variables. Do not change the settings here, overload them in Main.TWikiPreferences. To overload a plugin setting, prefix it withCHARTPLUGIN_. For example, to overload the BGCOLOR setting, add a * Set CHARTPLUGIN_BGCOLOR = ... bullet in Main.TWikiPreferences.
- Short description:
- Set SHORTDESCRIPTION = Visualize TWiki tables with area charts, bar charts, line graphs, scatter charts and sparklines
- Set DEBUG to 1 to get debug messages in
data/debug.txt. Default:0- Set DEBUG = 0
- Default chart used:
area,line,bar,scatterorcombo. Default:line- Set TYPE = line
- Default dimensions, scale and colors for a chart. See details in the syntax rules.
- Set WIDTH = 400
- Set HEIGHT = 250
- Set AREA_COLORS = #FF3333, #FFFF33, #33FF33, #CC66FF, #99FFFF, #FFCC00, #008000, #FF8080, #3366CC, #800080
- Set LINE_COLORS = #FF0000, #FFCC00, #00CC00, #FF00FF, #33CCCC, #FF8000, #009900, #FF6666, #3333FF, #800080
- Define the default background colors. The first color is the area outside of the chart, the second color is the area inside the chart, and the third color is the color inside of data label boxes.
- Set BGCOLOR = #FFFFFF, #FFFFFF, #FFFFFF
- Define the number of grids and grid color. When xgrid/ygrid = "on", then just use the first color when drawing grid lines. When their value is "dot", then use the full specification for drawing the grid lines ("transparent" can be used to introduce holes in the line). By default, the system will auto calculate the number of Y grids to draw (up to a max of 9). Specify a value for
NUMYGRIDSfor a system wide absolute defautl setting.- Set GRIDCOLOR = #808080, #808080, #808080, transparent, transparent, transparent
- Set NUMYGRIDS =
- Define the chart border color. Can be 'transparent';
- Set BORDERCOLOR = #000000
- Define what to do when an empty table cell is found. "none" means assume no default value. A value of "10" would mean empty cells would be assumed to have a value of 10
- Set DEFAULTDATA = none
- Define the default scale: linear or semilog
- Set SCALE = linear
- Define the number of pixels wide lines are drawn with
- Set LINEWIDTH = 3
- Define the number of pixels (in both the X and Y directions) to use when drawing a point
- Set POINTSIZE = 5
- The following bar parameters are now obsolete and are no longer used. They are replaced with the new bar parameters shown below.
- Set BARLEADINGSPACE = 6
- Set BARTRAILINGSPACE = 6
- Set BARSPACE = 5
- New bar chart specific parameters. The following values are all relative to each other and define the relative sizes of various bar widths.
BARLEADINGSPACEUNITSdefines how wide the space is before the first bar.BARTRAILINGSPACEUNITSdefines how wide the space is after the last bar.BARSPACEUNITSdefines how wide the space is between bars.BARWIDTHUNITSdefines how wide the actual bars are.- Set BARLEADINGSPACEUNITS = 1
- Set BARWIDTHUNITS = 2
- Set BARSPACEUNITS = 1
- Set BARTRAILINGSPACEUNITS = 1
- The following parameters are specific to
sparkbarand are all relative to each other and define the relative sizes of various spark bar widths.SPARKBARSPACEUNITSdefines how wide the space is between spark bars andSPARKBARWIDTHUNITSdefines how wide the actual spark bars are.- Set SPARKBARWIDTHUNITS = 2
- Set SPARKBARSPACEUNITS = 1
- Define the default error generation behavior. Are any errors shown as simple
text, inside of animage, or no error at all withnone- Set SHOWERROR = text
Syntax Rules
The%CHART{...}% variable gets expanded to an image representing the chart.
- Some parameters expect a range of table cells, using extended SpreadSheetPlugin syntax:
- A single table cell can be addressed as
R1:C1where cell addresses are:R1:C1R1:C2R1:C3R1:C4R2:C1R2:C2R2:C3R2:C4
- A single table cell can be addressed as
- A range of table cells is defined by two cell addresses separated by
"..". For example, "row 1-20, column 3" is:R1:C3..R20:C3and "row 15-5, column 2" is:R15:C2..R5:C2 - Ranges can be discontinuous. Discontinous ranges are joined using
"+"or",". For example:R4:C1..R5:C2+R9:C1..R15:C2. - When you are specifying datasets, you specify the range so that you have one data set per row (column). You can also specify multiple data sets using discontinuous blocks of cells; for example,
R4:C1..R5:C2,R9:C1..R10:C2specifies 4 data sets: R4:C1..R4:C2, R5:C1..R5:C2, R9:C1..R9:C2 and R10:C1..R10:C2 - It is possible to specify a constant value instead of a range of table cells. For example:
R1:C3..R20:C3,0as adataordata2value would create a data set with the constant value =0which could be used to highlight the zero line when data is both negative and positive, orR1:C1..R1:C3,0as adatalegendvalue would set the legend of the 4th data set =0. -
+has higher precedence than, - All parameters ending with
2(like:data2andylabel2) are relative to the right Y axis. The default is relative to the left Y axis.
| %CHART% Parameter | Comment | Default | ||||||||||||||
|---|---|---|---|---|---|---|---|---|---|---|---|---|---|---|---|---|
type |
The type of chart to create. One of "area", "bar", "line", "scatter", "combo", "sparkline", "sparkbar", or "sparkarea" |
Global TYPE setting |
||||||||||||||
subtype and subtype2 |
Sub type of selected data. subtype applies to data while subtype2 applies to data2. Supported values depend on chart type: |
|||||||||||||||
- for type="area": subtype="area" |
"area" |
|||||||||||||||
- for type="bar": subtype="bar" |
"bar" |
|||||||||||||||
- for type="line": subtype="line, point, pline" (point line) |
"line" |
|||||||||||||||
- for type="scatter": subtype="area, bar, line, point, pline" Note: you cannot mix area and bar on the same chart.Note: It is not recommended using showing a bar on a scatter chart as the X axis placement is skewed with bar and will not exactly line up with drawn X axis values which will defeat the purpose of using scatter in the first place. |
"point" |
|||||||||||||||
- for type="combo": subtype="area, bar, line, point, pline" (note: you can not mix area and bar on the same chart) |
All but the last data set are drawn as "area" and the last is drawn as "line" |
|||||||||||||||
You can use a comma delimited list of values to set a specific subtype for each data set. For example "area, area, point, line" would say that the first two data sets are areas, the third is point and the last one is a line |
||||||||||||||||
scale |
The scale to use when creating the chart. "linear" or "semilog" |
Global SCALE setting |
||||||||||||||
name |
Name to uniquely identify the chart file that is auto-created. | None; is required for all charts | ||||||||||||||
web |
The web in which to find topic (specified below) in which to find the TWiki tables |
The current web | ||||||||||||||
topic |
The topic in which to find the TWiki tables | The current topic | ||||||||||||||
table |
TWiki table used to build the chart. A numerical value refers to the table number, where "1" is the first table seen in a topic. Any other non-numeric string refers to a named table defined by the TABLE variable with a name parameter. For example, table="trends" refers to the table that is preceded by %TABLE{ name="trends" }%. |
"1" |
||||||||||||||
title |
The title placed at the top of the chart | None | ||||||||||||||
xlabel |
The label placed under the X axis describing the X values | None | ||||||||||||||
ylabel and ylabel2 |
The label placed to the left of the left Y axis (ylabel) or right of the right Y axis (ylabel2) describing the Y values |
None | ||||||||||||||
data and data2 |
The source data displayed on the chart. Values specified with data are displayed relative to the left Y axis while values specified with data2 are displayed relative to the right Y axis. In both cases, they define either a range of table cells or explicit data values. For example for type="line", a data="R2:C3..R999:C6" would say that four lines were to be drawn with the first line being rows 2-999 column 3 and last line being rows 2-999 column 6. In the case of a scatter graph, data represents the actual Y values. Note: Reversed data is allowed so data="R999:C6..R2:C3" is a legal data specification. Explicit data is also allowed so data="R999:C6..R2:C3,0" would draw 5 lines, the first 4 coming from the table and the 5th having a constant value of 0. |
None; is required for all charts | ||||||||||||||
defaultdata |
If there is sparse data, then use the value specified by defaultdata to fill in the missing data. A value of "none" means only draw actual data points. |
Global DEFAULTDATA setting |
||||||||||||||
xaxis |
X-Axis labels: The values are defined as a range of table cells. In case of scatter graph, xaxis represents the actual X values. The range also defines the orientation -- row or column oriented (if specified). For example "R2:C2..R999:C2" would take all of column 2 starting at row 2 and going through row 999. It would also denote that all remaining data is oriented columnar. |
None. Is required for type="scatter". If not specified, then no X axis labels shown and data assumed to be in columnar format. |
||||||||||||||
xaxisangle |
Angle the X-Axis labels are drawn. Only two angles are supported at this time, "0" draws horizontal labels, other numbers draw vertical labels |
"0" |
||||||||||||||
yaxis and yaxis2 |
Y-Axis labels for the left Y axis and the right Y axis: "on" to show the labels, "off" for no labels. |
"off" |
||||||||||||||
xmin |
Minimum value drawn on the X axis. Note: this is only applicable for scatter charts. |
The minimum value specified by xaxis |
||||||||||||||
xmax |
Maximum value drawn on the X axis. Note: this is only applicable for scatter charts. |
The maximum value specified by xaxis |
||||||||||||||
ymin and ymin2 |
Minimum value drawn on the left (ymin) and right (ymin2) Y axis |
The minimum value specified by data and data2 |
||||||||||||||
ymax and ymax2 |
Maximum value drawn on the left (ymax) and right (ymax2) Y axis |
The maximum value specified by data and data2 |
||||||||||||||
xgrid |
Grid shown for X axis: "on" for solid grid lines, "dot" for dotted grid lines, "off" for none. |
"dot" |
||||||||||||||
ygrid |
Grid shown for Y axis: "on" for solid grid lines, "dot" for dotted grid lines, "off" for none. |
"dot" |
||||||||||||||
numygrids |
Number of Y axis grids drawn | Global NUMYGRIDS setting |
||||||||||||||
ytics and ytics2 |
Number of tic marks to draw between Y axis grid lines for the left (ytics) and right (ytics2) Y axis. |
If scale="semilog", then ytics="10", else defaults to "0" |
||||||||||||||
numxgrids |
Number of X axis grids drawn. This can be used if there are a large number of X axis data points such that the X axis labels overlap. | Draw all X-Axis labels | ||||||||||||||
datalabel and datalabel2 |
Shows data value labels above drawn data points for data and data2 data. Possible values are:
|
"off" |
||||||||||||||
legend |
Legend shown to the right of the chart. For example "R1:C3..R1:C6" would take all of row 1 starting at column 3 and going through column 6 as the name/legend of each set of data points |
None; no legend if not specified | ||||||||||||||
width |
Defines the overall width of the chart in pixels. Note: if type="sparkbar" and width="0", then the width will be auto computed to be the minimum width to allow easily readable spark bars. |
Global WIDTH setting |
||||||||||||||
height |
Defines the overall height of the chart in pixels. | Global HEIGHT setting |
||||||||||||||
alt |
Alternate text for chart image | Empty alt tag | ||||||||||||||
colors and colors2 |
A list of colors defining the color of each set of data points for data and data2. Color values are of the form: Hexadecimal RGB color "#ffffff" or "transparent" |
Global LINE_COLORS setting for lines; global AREA_COLORS setting for area |
||||||||||||||
bgcolor |
Background color of the area surrounding/outside the chart, the area inside the chart, and the data label boxes. Color values are of the form: Hexadecimal RGB color "#ffffff" or "transparent". For example, "#e7e7e7" sets a light gray background (outside the chart) color. Optionally specify a second values for the chart background itself (the inside color) and an optional third value which is the value of the color to fill data label boxes with. For example, "#e7e7e7, #ffffc0" defines a chart with a light yellow inside background on a light gray outside, with default data label box background color. |
Global BGCOLOR setting |
||||||||||||||
gridcolor |
Colors/style of the grid (if any). If xgrid="on" or ygrid="on" then use the first gridcolor for drawing solid grid lines. If xgrid="dot" or ygrid="dot", then use the full set of colors to define the line style for drawing the grid lines. "transparent" can be used to introduce holes in the line." |
Global GRIDCOLOR setting |
||||||||||||||
linewidth |
Width of data lines in pixel | Global LINEWIDTH setting |
||||||||||||||
pointsize |
Size of data points in pixel | Global POINTSIZE setting |
||||||||||||||
showerror |
Specify how any error messages are handled. Possible values are:
|
Global SHOWERROR setting |
||||||||||||||
| (other parameters) | Other parameters are passed on to the img tag. Useful to add additional image parameters like align="right" |
None |
datatype maps to subtype, arealine maps to combo.
Examples
Assuming the following three TWiki tables. The first shows the data oriented in columns while the seconds shows the data oriented in rows
Table 1
|
Table 2:
|
Table 3:
|
| Type of chart | You type | You should get... | ...if installed |
|---|---|---|---|
| area | Multiple areas %CHART{name="area1" table="exampleTable2" type="area" data="R2:C2..R99:C6" xaxis="R1:C2..R1:C99" legend="R2:C1..R99:C1" ymax="30" width="225" height="200" numygrid="4"}% |
 |
 |
| bar | Multiple bars %CHART{name="bar1" table="exampleTable2" type="bar" data="R3:C2..R99:C4" xaxis="R1:C2..R1:C4" legend="R3:C1..R99:C1" ymin="0" ymax="19" numygrids="9" width="225" height="200"}% |
 |
 |
| line | Simple line %CHART{name="line1" table="exampleTable1" type="line" data="R2:C2..R6:C2" xaxis="R2:C1..R6:C1" legend="R1:C2..R1:C2" ymin="5" ymax="40" numygrids="6" width="225" height="200"}% |
 |
 |
| line | Multiple lines %CHART{name="line2" table="exampleTable2" type="line" data="R2:C2..R5:C6" xaxis="R1:C2..R1:C6" legend="R2:C1..R5:C1" ymin="5" ymax="30" numygrids="4" width="225" height="200"}% |
 |
 |
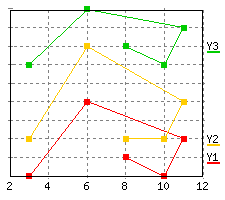
| scatter | Multiple scatter %CHART{name="scatter1" table="exampleTable3" type="scatter" subtype="pline" data="R2:C2..R6:C4" xaxis="R2:C1..R6:C1" legend="R1:C2..R1:C4" ymin="1" ymax="10" xmax="12" numygrids="8" numxgrids="8" linewidth="1" width="225" height="200"}% |
 |
 |
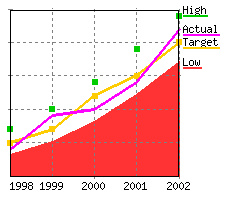
| combo | Combo with area, pline, point, & line %CHART{name="combo1" table="exampleTable2" type="combo" subtype="area, pline, point, line" data="R2:C2..R5:C6" xaxis="R1:C2..R1:C6" legend="R2:C1..R5:C1" ymin="5" ymax="30" numygrids="4" numxgrids="4" width="225" height="200"}% |
 |
 |
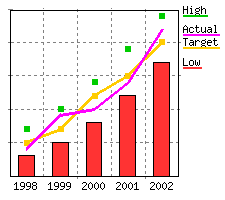
| combo | Combo with bar, pline, point, & line %CHART{name="combo2" table="exampleTable2" type="combo" subtype="bar, pline, point, line" data="R2:C2..R5:C6" xaxis="R1:C2..R1:C6" legend="R2:C1..R5:C1" ymin="5" ymax="30" numygrids="4" numxgrids="4" width="225" height="200"}% |
 |
 |
| sparkline | sparkline %CHART{name="sparkline" type="sparkline" data="88, 84, 82, 92, 82, 86, 66, 82, 44, 64, 66, 88, 96, 80, 24, 26, 14, 0, 0, 26, 8, 6, 6, 24, 52, 66, 36, 6, 10, 14, 30" width="75" height="16" colors='#224262' bgcolor='transparent'}% |
|
 |
| sparkbar | sparkbar %CHART{name="sparkbar1" type="sparkbar" data="88, 84, 82, 92, 82, 86, 66, 82, 44, 64, 66, 88, 96, 80, 24, 26, 14, 0, 0, 26, 8, 6, 6, 24, 52, 66, 36, 6, 10, 14, 30" width="75" height="16" colors='#224262' bgcolor='transparent'}% |
 |
 |
| sparkbar | sparkbar (width="0" so the width will be auto sized) %CHART{name="sparkbar2" type="sparkbar" data="88, 84, 82, 92, 82, 86, 66, 82, 44, 64, 66, 88, 96, 80, 24, 26, 14, 0, 0, 26, 8, 6, 6, 24, 52, 66, 36, 6, 10, 14, 30" width="0" height="16" colors='#224262' bgcolor='transparent'}% |
|
 |
| sparkarea | sparkarea %CHART{name="sparkarea" type="sparkarea" data="88, 84, 82, 92, 82, 86, 66, 82, 44, 64, 66, 88, 96, 80, 24, 26, 14, 0, 0, 26, 8, 6, 6, 24, 52, 66, 36, 6, 10, 14, 30" width="75" height="16" colors='#224262' bgcolor='transparent'}% |
|
 |
Charts with SEARCH and CALC
Charts can be created dynamically based on TWiki tables with SEARCH and CALC. SEARCH: Create a table dynamically with a formatted search, then visualize it with a CHART. If the number of rows in a table is not known, specify a big row number in the CHART, such asdata="R2:C2..R999:C7". The ChartPlugin is smart enough to use the actual number of rows.
CALC: Table cells can be created dynamically with SpreadSheetPlugin formulas. Here is an example table that sums up the total in the right hand column:
Raw text of table:
%TABLE{name="exampleTableWithCALC"}%
|   | A | B | Total |
| 1 | 7 | 9 | %CALC{$SUM(R$ROW():C1..R$ROW():C3)}% |
| 2 | 5 | 2 | %CALC{$SUM(R$ROW():C1..R$ROW():C3)}% |
| 3 | 5 | 7 | %CALC{$SUM(R$ROW():C1..R$ROW():C3)}% |
|
Table:
|
Resulting chart: 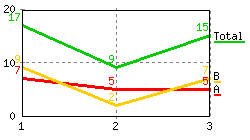
|
- Set SPREADSHEETPLUGIN_SKIPINCLUDE = 0
Output
- A graphics file in PNG or GIF format is created containing the chart results. The file is placed in
%PUBURLPATH%/%WEB%/%TOPIC%/_ChartPlugin_<type>_<name>.pngor.gif(GIF for GD version 1.19 or older) -
%CHART{...}%gets expanded to an<img ... />image tag.
Error Handling
If the required parameters are not defined, then an error message is returned or an <img ... /> image tag is returned pointing to a graphic containing the error message.Plugin Installation Instructions
You do not need to install anything in the browser to use this extension. The following instructions are for the administrator who installs the extension on the server where TWiki is running. Like many other TWiki extensions, this module is shipped with a fully automatic installer script written using the BuildContrib.- If you have TWiki 4.2 or later, you can install from the
configureinterface (Go to Plugins->Find More Extensions)- See the installation supplement
 on TWiki.org for more information.
- See the installation supplement
- If you have any problems, then you can still install manually from the command-line:
- Download one of the
.zipor.tgzarchives - Unpack the archive in the root directory of your TWiki installation.
- Run the installer script (
perl <module>_installer) - Run
configureand enable the module, if it is a plugin. - Repeat for any missing dependencies.
- Download one of the
- If you are still having problems, then instead of running the installer script:
- Make sure that the file permissions allow the webserver user to access all files.
- Check in any installed files that have existing
,vfiles in your existing install (take care not to lock the files when you check in) - Manually edit LocalSite.cfg to set any configuration variables.
- Check above examples if the "if installed" column shows images instead of variables.
- Check ChartPluginTests for some more tests
Plugin Info
| Plugin Author: | TWiki:Main.PeterThoeny |
| Copyright: | © 2002-2011 Peter Thoeny, Twiki, Inc. © 2008-2011 TWiki:TWiki.TWikiContributor |
| License: | GPL (GNU General Public License |
| Plugin Version: | 2011-06-01 (v21356 (2011-06-01)) |
| Change History: | |
| 2011-06-01: | TWikibug:Item6741 |
| 2011-05-27: | TWikibug:Item6735 |
| 2011-05-13: | TWikibug:Item6701 |
| 2011-05-13: |
|
| 2011-05-11: |
|
| 2011-05-05: | TWikibug:Item6714showerror option.-- TWiki:Main.TaitCyrus |
| 2011-05-03: |
|
| 2011-04-27: |
|
| 2011-04-26: | Fixed bugs:
|
| 2010-11-04: | TWikibug:Item6600 |
| 2010-06-26: | TWikibug:Item6003 |
| 2010-04-07: | TWikibug:Item6160 |
| 2009-10-23: | TWikibug:Item6355 |
| 18 May 2007: | Added discontinuous ranges - TWiki:Main.CrawfordCurrie |
| 16 Nov 2004: | V1.401 - Added benchmarks (no code changes) |
| 30 Aug 2004: | V1.400 - Added support for subtype="bar" (includes various global bar settings), updated gridcolor to not only define the grid color but allowing the user to define the line style (for drawing user defined dotted lines), add a global for how wide lines are drawn instead of a hard coded value, change the order of how things are drawn so now the order is: areas, grid lines and X/Y axis labels, bars, lines/points/plines, rectangle around chart, data point labels, chart title/X/Y labels, and finally the legends. |
| 13 May 2004: | V1.300 - Added support for type="scatter"; renamed type="arealine" to "combo" (arealine is undocumented); renamed datatype to subtype (datatype is undocumented); added subtype options "point" and "pline", added new settings GRIDCOLOR, DEFAULTDATA, POINTSIZE; fixed bug with how the number of grids were drawn |
| 17 Oct 2003: | V1.201 - Fix boundary cases with semilog scale |
| 16 Oct 2003: | V1.200 - Add new options of scale and ytics. |
| 16 Jun 2003: | V1.100 - Add support for reversed tables (R999..R1), add new options of xaxisangle, numxgrids, and defaultdata, and allow sparse data. |
| 7 Oct 2002: | V1.003 - Improved performance, fixed bugs with color allocation, auto-legend placement and parsing of numbers in tables. Also bumped the upper value when numbers switch from decimal format to engineering format |
| 13 Sept 2002: | V1.002 - Add support for better placement of legends so they don't overlap, add auto ymin/ymax determination if not specified, add bgcolor and numygrids options |
| 27 Jun 2002: | V1.001 - Data range specified is clipped to actual table size; more forgiving data parsing by extracting first numeral from a table cell, e.g. extract 25 from <u>25%</u> |
| 20 Jun 2002: | Initial version (V1.000) |
| TWiki dependencies: | $TWiki::Plugins::VERSION 1.1 |
| Dependencies: | gd (see http://www.libgd.org/ |
| CPAN Dependencies | CPAN:GD |
| TWiki:Plugins/Benchmark |
GoodStyle 96%, FormattedSearch 97%, ChartPlugin 69% |
| Plugin Home: | http://TWiki.org/cgi-bin/view/Plugins/ChartPlugin |
| Feedback: | http://TWiki.org/cgi-bin/view/Plugins/ChartPluginDev |
| Appraisal: | http://TWiki.org/cgi-bin/view/Plugins/ChartPluginAppraisal |
Topic revision: r5 - 2011-06-02 - PeterThoeny


Ideas, requests, problems regarding TWiki? Send feedback